Alpino Wind Tunnel
Upload STL or image models, rotate them in 3D, and visualize airflow impact by color.
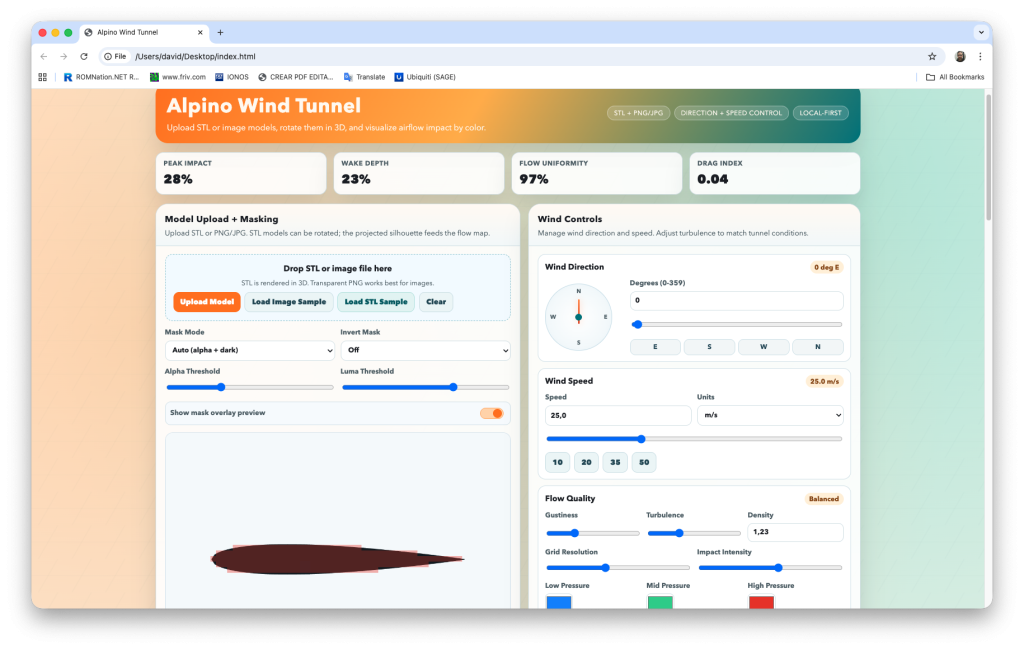
Model Upload + Masking
Upload STL or PNG/JPG. STL models can be rotated; the projected silhouette feeds the flow map.
Drop STL or image file here
STL is rendered in 3D. Transparent PNG works best for images.
Show mask overlay preview
Sample model loaded.
STL Viewer
3D Rotation
X 18 / Y 28 / Z 0Model Appearance
Colors
Show mesh edges
Wind Controls
Manage wind direction and speed. Adjust turbulence to match tunnel conditions.
Wind Direction
0 deg EN
E
S
W
Wind Speed
25.0 m/sFlow Quality
Balanced
Live flow animation
Show streamlines
Show impact overlay
Impact Visualization
Color overlay shows pressure impact. Blue indicates low pressure wake, red indicates high pressure impact.
Drag to rotate STL. Scroll to zoom.
Impact View
Zoom 100%Drag on the impact canvas to rotate the STL model. Scroll to zoom.
Wake
Neutral
Impact
Avg Pressure
0.00
Peak Pressure
0.00
Wake Pressure
0.00
Flow Energy
0.00
Metrics are relative and for visual analysis only. Use real CFD or wind tunnel data for certification.
Analysis Notes
Quick observations generated from the current flow map.
Alpino Wind Tunnel — Software Specs
Location
Type
- Single‑file, local‑first web app (HTML/CSS/JS) running entirely in the browser.
Purpose
- Visual, interactive wind‑tunnel style analysis: airflow impact overlay, wind direction/speed control, and STL/image model preview.
Inputs
- STL files (binary or ASCII).
- PNG/JPG images (transparent PNG preferred for clean masks).
Core Features
- 3D STL viewer with drag‑to‑rotate, sliders (X/Y/Z), and auto‑spin.
- Impact visualization with wind direction + speed controls.
- Color‑mapped pressure overlay (low: blue/green → high: red).
- Airflow visualization using animated flow lines.
- Masking controls for images (alpha/luma thresholds, invert, overlay preview).
- Adjustable flow quality: turbulence, gustiness, density, grid resolution, impact intensity.
- Color pickers for flow palette and model appearance (model/edge/background).
Controls
- Wind direction dial + numeric + slider.
- Wind speed with units (m/s, km/h, mph).
- Impact zoom for analysis view (scroll or slider).
- STL rotation from both 3D viewer and impact canvas (drag).
Outputs
- Snapshot PNG export captures the full analysis panel (canvas + legend + metrics).
- JSON report export with current settings and metrics.
Metrics Shown
- Peak impact, wake depth, flow uniformity, drag index.
- Avg/Peak/Wake pressure, flow energy.
Limits
- STL triangle cap: 60,000 triangles (extra are truncated for performance).
- Visual analysis only; not a certified CFD solver.
Runtime Requirements
- Modern desktop browser with Canvas support (Chrome, Edge, Safari, Firefox).
- No server, no external dependencies.